


I bet that’s not how you thought that title would end, right?
The stock market is sitting near all-time highs. The S&P 500 index has been up double digits for three straight years. The talking heads on your TV are screaming words like “bubble” and “overheated” to describe the market.
So how on earth can it be getting cheaper? Allow me to explain.
The Basics: The Price-to-Earnings (P/E) Ratio
The most fundamental way to value a company is the Price-to-Earnings (P/E) ratio. Essentially, we divide a company’s total stock market value by its trailing 12 months of profits.
- The Math: Total Value of a Company / Last 12 months Earnings = P/E Ratio
- The Example: Say Company XYZ is valued at $2.5 billion. Over the past year, they earned $100 million in net profit.
- The Result: $2.5 billion / $100 million gives us a P/E ratio of 25.
Now we can do this for all of the companies that comprise the S&P 500 index and generate an average P/E ratio for the entire index and this gives us a decent idea of how the overall market is valued. Historically, stocks have traded somewhere between 15 to 20x earnings, or a P/E ratio of 15 to 20. When the aggregate P/E goes near or below 15, it’s usually a signal that stocks are becoming pretty cheap. When the P/E ratio goes over 20, folks start to get a little nervous that things are getting too expensive. So our company XYZ would probably be considered too expensive and pretty risky if all we were looking at was the P/E ratio
But there is a major flaw with relying solely on standard P/E ratios…
The Problem: Rearview Mirror Investing
The standard P/E ratio evaluates a company based entirely on what has happened, not what is happening.
The stock market is forward-looking. What happened yesterday is already old news. The market is a discounting mechanism, meaning it tries to gauge how much we should pay today for what a company will earn in the future.
So because the market is a forward looking pricing mechanism, I don’t personally find much value in analyzing how a particular stock or stock market index is priced based solely on what happened in the past. We also need to consider how fast the underlying business is growing.
Enter the G: Earnings Growth Rate
Let's look back at Company XYZ.
We know company XYZ made $100 million in the prior 12 months….and let’s say we know that the year before that they earned $75 million, and next year they’re expected to earn $130 million. From these figures we could calculate that their earnings growth rate is around 30%.
By understanding the earnings growth rate, we now have everything we need to calculate my personal favorite stock market metric: the PEG ratio.
The Ultimate Metric: The PEG Ratio
To find the PEG ratio, you simply take the P/E ratio and divide it by the earnings growth rate.
- P = Price (Total value of the company)
- E = Earnings (How much profit they make)
- G = Growth (How fast those profits are growing)
Let's plug Company XYZ into this formula. We take its P/E ratio of 25 (which a lot of folks would consider too expensive) and divide it by its 30% growth rate. 25 / 30 = 0.83. So XYZ has a PEG Ratio of 0.83.
As a general framework, most value-conscious growth investors interpret PEG values as follows:
- Below 1.0: Potentially undervalued relative to growth
- Around 1.0: Fairly valued
- 1.0 to 2.0: Moderately elevated
- Above 2.0: Expensive, with a thin margin of safety
Suddenly, our "overvalued" Company XYZ with a scary P/E of 25 looks like a potential bargain at a PEG of 0.83. Once you account for how fast the underlying business is growing, the current price represents a potential buying opportunity.
The Big Picture: Why the Market is Getting Cheaper
This brings me to my final point….the statement I made in the headline of this article.
The stock market is actually becoming….. CHEAPER.
The current blended P/E ratio for the entire S&P 500 stands at about 24, above long-term averages and the primary data point the talking heads point to when trying to convince you the market is too expensive or it’s a bubble. But when we add the G (earnings growth rate) to the equation, it tells a us totally different story.
According to FactSet, in the most recent earnings reports S&P 500 constituents are showing earnings growth of 29% thanks to massive technological shifts and booming corporate efficiencies. So we divide the market’s current P/E ratio of 24 by the earnings growth rate of 29, we get a PEG ratio of 0.83. If we recall the generally accepted framework above…
- Below 1.0: Potentially undervalued relative to growth
So by simply adding the all-important G to our P/E we go from a market that is seemingly overvalued to a market that may actually be undervalued.
And if we look at this chart….we see the PEG ratio has fallen quite dramatically recently even while the market has climbed to new highs. And this is because corporate earnings are actually growing faster than the market is climbing.
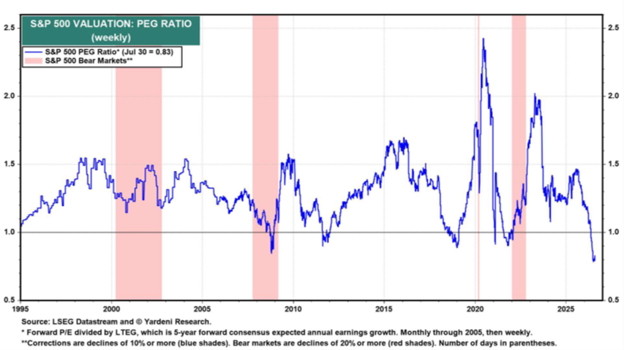
So yes, the market is at all-time highs, but that doesn’t mean it’s overpriced. We have to consider that corporate profits are also growing rapidly. If you judge current stock prices by what these companies are on track to achieve tomorrow, the stock market is actually getting…. cheaper.
Having Said That...
Does this mean the market will keep rising? Of course not. The next correction is always somewhere on the horizon. Corrections are part of investing and they can happen at any time. The point of this article is simply to say that those who are solely pointing to current price levels to justify their doom and gloom are not seeing the full picture.