


Look....I get it. Yesterday was a brutal day for the stock market. It's not often you see the S&P 500 fall 4% in a single session. According to Bespoke research, going back to 1952 we've only seen 52 4% down days out of 18,650 total trading days. That equates to about 0.3% of the time. In other words....We see a day like this about once every 18 months. It just so happens that the last time we saw one was....19 months ago. And at that time we actually got back-to-back 4% down days:
April 3rd, 2025 (unhappy birthday to me) and then again on April 4th.
So while it's certainly not common to see moves like we saw yesterday....It's also not all that uncommon either. But what I think you're probably most interested in is....What happens next? Well, let's block out all the noise and conjecture for a moment and just take a hard look at the data.
In the chart below we are seeing the 1-week return of the S&P 500 following every election going back to 1952.
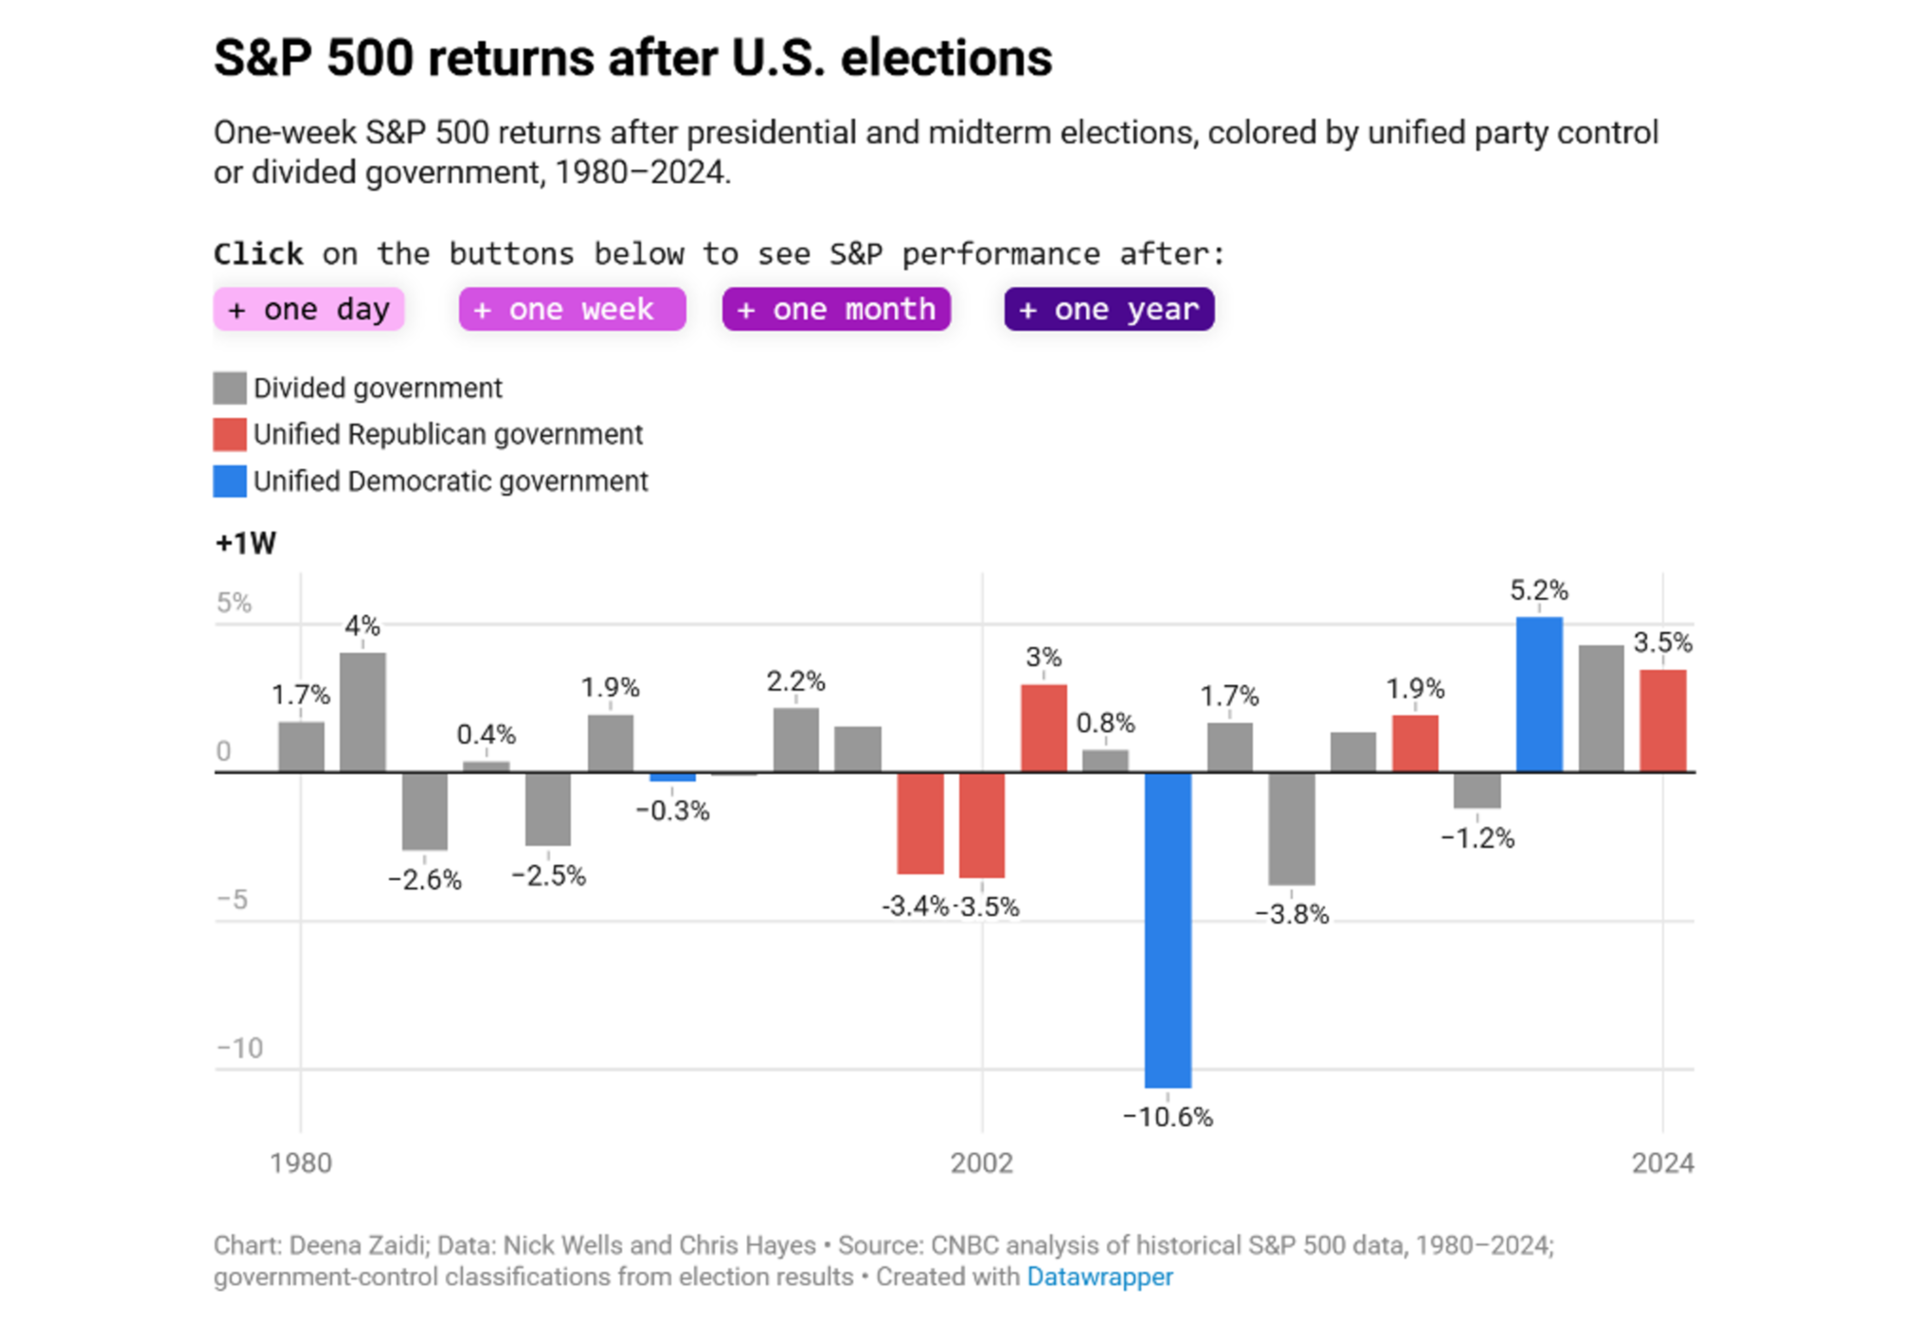
The first thing I want you to notice is how many times the market was negative one week after the election results were in. 9 out of 23 instances, or about 40% of the time, the market was lower. The average 1-week return from all 23 elections was zilch. Nada. So seeing the market down immediately following an election is not unusual at all. And you can see some of the 1-week returns were pretty nasty. But as a financial advisor I'm always coaching my clients to not get too wrapped up in the short-term swings of the market and to maintain a long-term perspective. We should be measuring our progress in years, not days, weeks or months. I often say: When in doubt, zoom out.
So let's do that now.
If I simply toggle the chart above to switch from the 1-week return following the elections to the 1-year return following the elections, we see a totally different story.
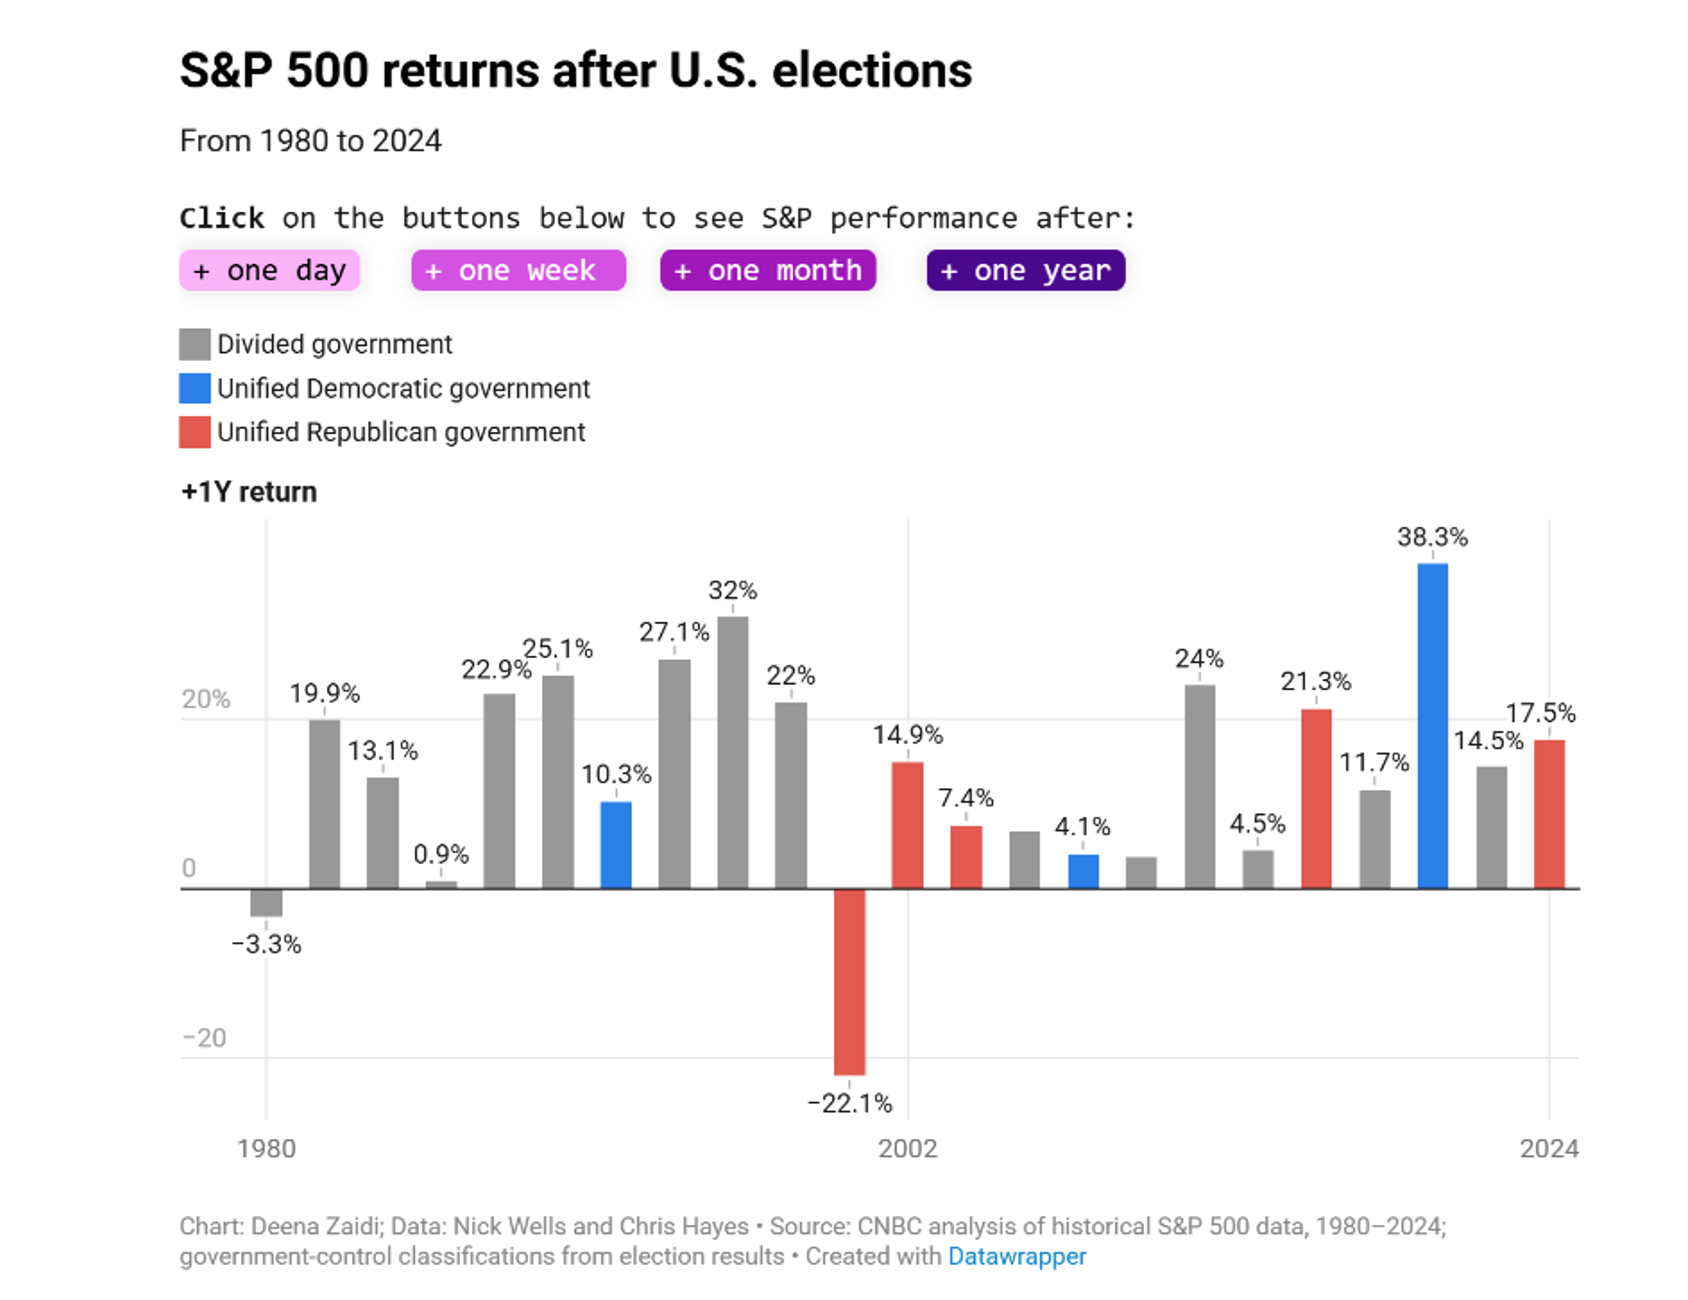
Now all of the sudden we've got 21 of 23 results showing positive returns, or 91% of the time. Moreover, the average of all of these 1-year returns is 13.8%. So by expanding our time horizon from 1 week to 1 year we see...
- Our probability of a positive return jump to 91%
- The total average return jump from zero to almost 14%
"But Nathan.....this time is different....Democrats just swept both houses. This isn't like every other election"
Fair point.....But Democrats flipping both houses in the midterms under a Republican President is actually nothing new. We have plenty of historical instances of this....and I happen to have the data on how the market performed in those instances. Take a look below...
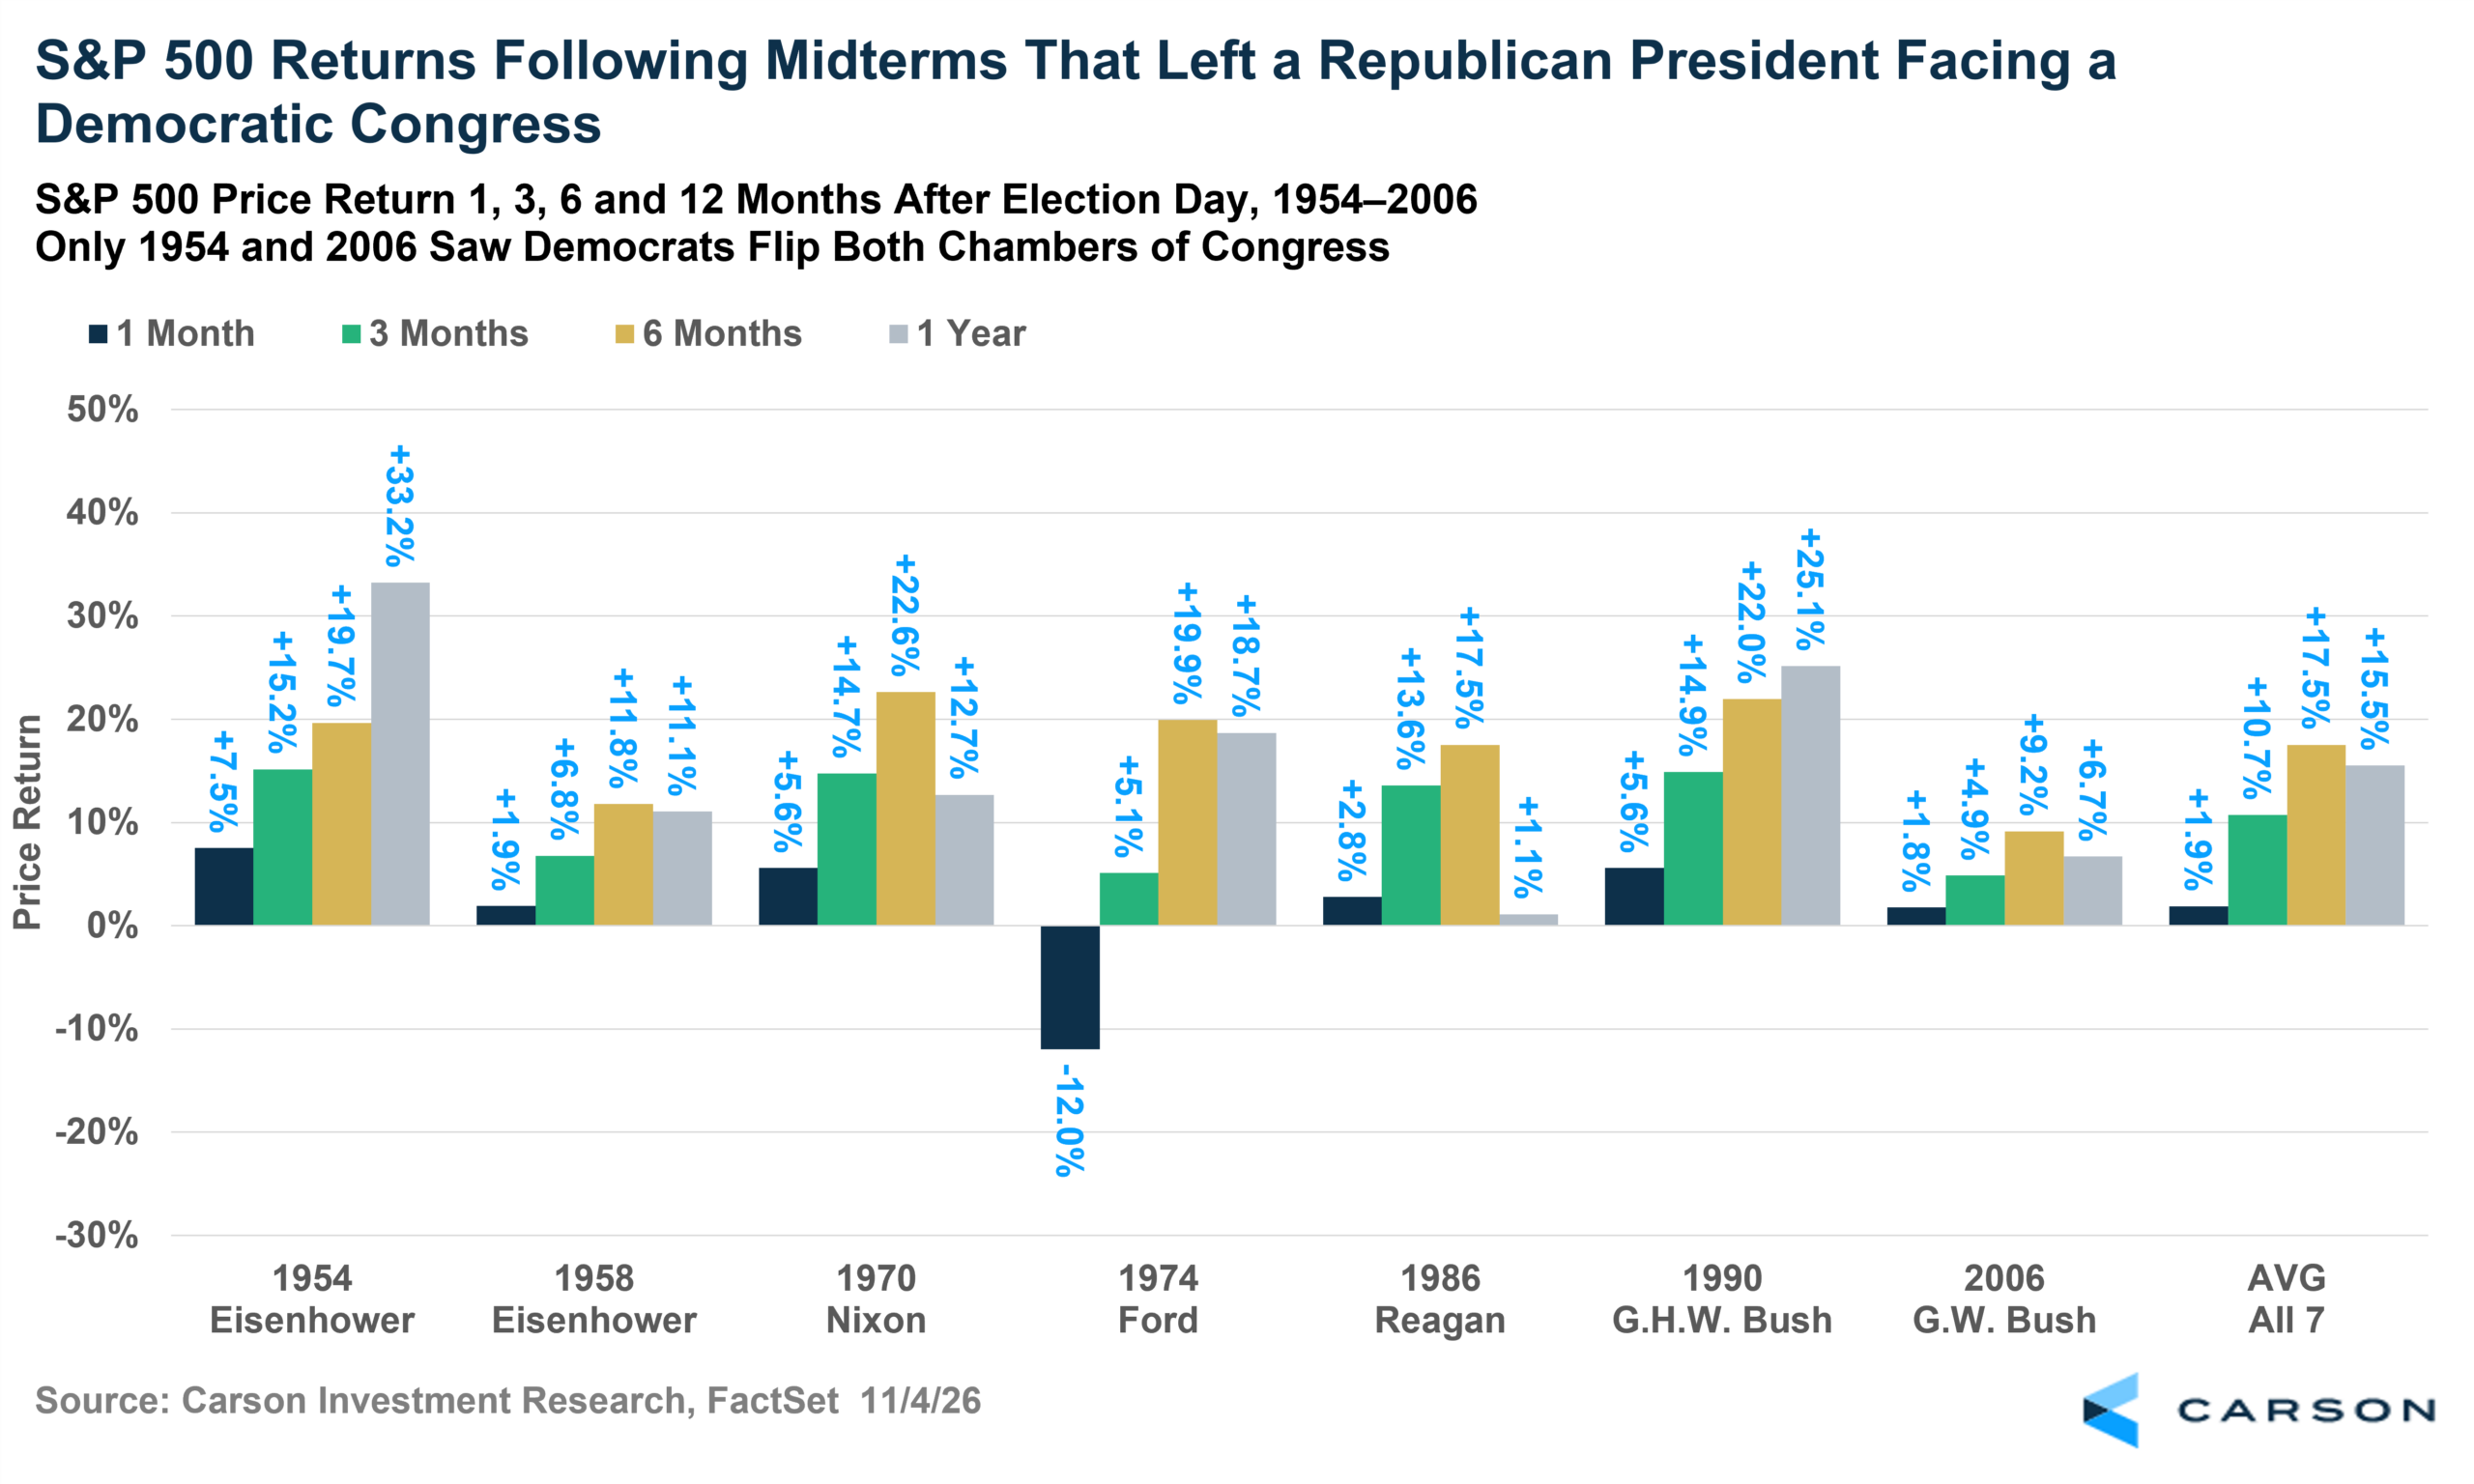
This chart shows us a lot of useful information. We get to see how the S&P 500 performed 1 month, 3 months, 6 months and 1 year following all of the previous instances where Democrats flipped both houses in the midterms under a Republican President. On the far right we get to see the averages...
Key Takeaway: We have seen Democrats take control of both houses under a Republican President 7 times before. In all 7 of those instances the market was higher 1 year later by an average of 15.5%.
I'm not saying this means we'll definitely be higher 1 year from now. Things that don't usually happen can happen at any time, especially in the stock market. The future is always uncertain. That is the risk. But we accept the risk because with risk comes the potential for reward. And the likelihood of being rewarded increases the more we expand our time horizon. Don't get too wrapped up in day-to-day swings in the markets. Stay focused on the long-term. If you let yourself get caught up in the daily movements of the stock market you'll be one stressed out individual.. That's my job :)
In closing....I know seeing days like yesterday are tough and I understand the concerns. Nobody wants to turn on the TV to a panel of folks telling us how horrible the market is and then go on to talk about how much worse it could get. That would wear on anybody. But these people are not trying to give you sound financial advice. They don't have your long-term interests in mind and they certainly don't know your unique circumstances. They don't care if they scare you into making a bad financial decision. Their job is to capture your attention and keep it as long as they can so their advertisers can show you their products. That's the game they play. That's not the game we play. We're long-term investors and we know that the longer we stay invested, the higher our likelihood of positive returns. The longer we can stay calm and patient, the more we're likely to be rewarded. The stock market is a mechanism that transfers wealth from the impatient investor to the patient investor, so let's make sure we stay on the right side of that equation when people are panicking. That's exactly when the wealth transfer tends to happen.
NZ
Securities and advisory serviced offered through LPL Financial, a registered investment advisor. Member FINRA/SIPC.
All investing involves risk including loss of principal. No strategy assures success or protects against loss. The opinions expressed in this material do not necessarily reflect the views of LPL Financial. Content in this material is for general information only and not intended to provide specific advice or recommendations for any individual. All performance referred is historical and is no guarantee of future results. All indices are unmanaged and may not be invested into directly.
The primary benchmarks for the large-cap market are: S&P 500 index. The S&P 500 index is considered the benchmark for the US Stock market. It is an index of approximately the largest 500 companies based on market capitalization.